
 CIMB has summed up that the drastic drop in BDI was mainly due to:
1. slow down in China
2. over-supply vessel.
3. reduction of 2nd hand vessel price
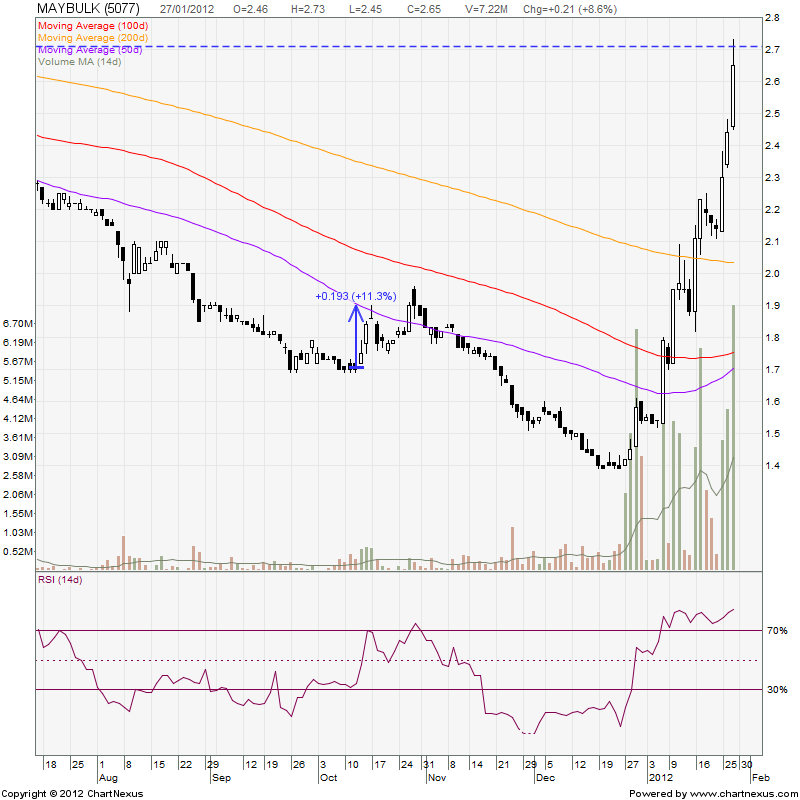
CIMB has summed up that the drastic drop in BDI was mainly due to: Those who bought at 0.95 level should sell for 10% gain now.
 For those who bought at 1.00 level is time to take some profit. Current price at 1.13. you should rake in handsome 13% gain (exclude transaction cost).
 YTLE - the next generation of broadband service provider carried the brand YES. Typically, broadband business is operating in a Oligopoly market. The incumbents are the big 3 TM, Digi, Maxis, + stand alone providers are, P1, YES, U mobile. Advantages of Oligopoly business include ability to conspire the offering price of their services. Generally EBITA margin is above 50%, hence a lucrative business. Nonetheless, this business require high capex to reach its critical mass in order to enjoy economic of scale and huge advertisement spending and huge client acquisition cost include subsidising the phone purchase by customer.
 Volume decline gradually during this phase. Observe the read box - there was sudden surge in volume and drastic drop in price signify selling climax. After the selling climax, it was quiet for another two months with price mark-down further from 75 sen to 70 sen. Strong accumulation seen in the green box with high surge of price and volume. it is also the first time the stock broke above MA50 and trade above MA100.
 PAT has been on uptrend from 1 mil to 9 mil for the last 8 quarters.
 Listed in July 2009. Classified as M-Chips by borrowing reference name from S-Chips (referring to China Companies listed in SGX). These small to mid size (by China definition) China Companies has difficulty to list in neither Shanghai Stock Exchange nor Hong Kong Stock Exchange. SGX has seized the opportunity to lure these China Companies to launch their IPO. These China Companies could easily qualify for mid to large cap stock in South East Asia's stock exchange. At peak, there were more than 200 China Companies listed in Singapore. However, after a few round of fun fare, good companies start to diminish. Second grade or rather low grade companies were also lure to list. These low grade stocks have eventually led to a few bad apples that shock the investment community in Singapore. The most infamous shocks include misappropriate of public funds and fictitious accounting practices. The revelation of this crisis made the investors and authorities become cautious on these companies. After a few year, the Malaysian investment banks and Bursa fill the gap by luring these companies to Malaysia. Eventually led to a few China Companies listed at Bursa. Those are Xinquan, Multi Sports, XDL and so on. However, the performance of these companies remain lackluster.
 PAT Jun 2010 = 105mil
 No significant movement by major shareholder for the last one year
Release Date: January 25, 2012
Information received since the Federal Open Market Committee met in December suggests that the economy has been expanding moderately, notwithstanding some slowing in global growth. While indicators point to some further improvement in overall labor market conditions, the unemployment rate remains elevated. Household spending has continued to advance, but growth in business fixed investment has slowed, and the housing sector remains depressed. Inflation has been subdued in recent months, and longer-term inflation expectations have remained stable.
Consistent with its statutory mandate, the Committee seeks to foster maximum employment and price stability. The Committee expects economic growth over coming quarters to be modest and consequently anticipates that the unemployment rate will decline only gradually toward levels that the Committee judges to be consistent with its dual mandate. Strains in global financial markets continue to pose significant downside risks to the economic outlook. The Committee also anticipates that over coming quarters, inflation will run at levels at or below those consistent with the Committee's dual mandate.
To support a stronger economic recovery and to help ensure that inflation, over time, is at levels consistent with the dual mandate, the Committee expects to maintain a highly accommodative stance for monetary policy. In particular, the Committee decided today to keep the target range for the federal funds rate at 0 to 1/4 percent and currently anticipates that economic conditions--including low rates of resource utilization and a subdued outlook for inflation over the medium run--are likely to warrant exceptionally low levels for the federal funds rate at least through late 2014.
The Committee also decided to continue its program to extend the average maturity of its holdings of securities as announced in September. The Committee is maintaining its existing policies of reinvesting principal payments from its holdings of agency debt and agency mortgage-backed securities in agency mortgage-backed securities and of rolling over maturing Treasury securities at auction. The Committee will regularly review the size and composition of its securities holdings and is prepared to adjust those holdings as appropriate to promote a stronger economic recovery in a context of price stability.
Voting for the FOMC monetary policy action were: Ben S. Bernanke, Chairman; William C. Dudley, Vice Chairman; Elizabeth A. Duke; Dennis P. Lockhart; Sandra Pianalto; Sarah Bloom Raskin; Daniel K. Tarullo; John C. Williams; and Janet L. Yellen. Voting against the action was Jeffrey M. Lacker, who preferred to omit the description of the time period over which economic conditions are likely to warrant exceptionally low levels of the federal funds rate.
 Stock market cycle is a derivative of economic/business cycle. History has shown us that economic/business cycle typically go through a period of boom phase led by greed - ie the mark-up phase. Bubble burst at the top with a mere push. Typically follow by mark-down phase lead by the fear.
 Another example of application of market cycle.

 The Mark - up Phase (July 2010 - Apr 2011 - 10 months)
 The major shareholders moved into this stock in Sep 2011 - signified the bottom of this stock. Coincidentally it is during the Accumulation phase above. We have yet to see the insider move into the stock into this work in Jan 2012.
 Fundamentally Kimlun remained profitable throughout the Mark-up Phase - signify the sound fundamental of the stock

| Rev | PAT | |
| Q409 | 224,143 | 41,577 |
| Q110 | 238,689 | 33,081 |
| Q210 | 241,465 | 36,493 |
| Q310 | 228,894 | 19,520 |
| Q410 | 242,138 | 17,745 |
| Q111 | 233,557 | 5,751 |
| Q211 | 252,279 | 12,532 |
| Q311 | 279,675 | 24,071 |


Haio another diving stock
March 2010 - 4.50
Sep 2011 - 1.50
67% value evaporated within 18 months. the interesting question is why?
| Financial Summary |
|
|
|
|
| Current Year Quarter | Current Year To Date |
| |||||||
| Revenue | P/L | EPS | Dividend | Revenue | P/L | ||||||||
| 21 Dec 2011 | HAIO | 2nd | 30 Apr 2012 | 56,199 | 7,868 | 3.94 | 2.00 | 107,172 | 15,601 | ||||
| 28 Sep 2011 | HAIO | 1st | 30 Apr 2012 | 50,973 | 7,734 | 3.87 | - | 50,973 | 7,734 | ||||
| 23 Jun 2011 | HAIO | 4th | 30 Apr 2011 | 58,156 | 8,547 | 4.28 | 5.50 | 223,150 | 28,829 | ||||
| 23 Mar 2011 | HAIO | 3rd | 30 Apr 2011 | 57,621 | 6,347 | 3.18 | - | 164,994 | 20,283 | ||||
| 17 Dec 2010 | HAIO | 2nd | 30 Apr 2011 | 52,622 | 6,132 | 3.07 | 2.00 | 107,374 | 13,935 | ||||
| 29 Sep 2010 | HAIO | 1st | 30 Apr 2011 | 54,751 | 7,804 | 3.91 | - | 54,751 | 7,804 | ||||
| 25 Jun 2010 | HAIO | 4th | 30 Apr 2010 | 98,838 | 14,257 | 7.14 | 14.50 | 511,064 | 70,916 | ||||
| 19 Mar 2010 | HAIO | 3rd | 30 Apr 2010 | 131,281 | 18,009 | 21.64 | 4.00 | 412,227 | 56,659 | ||||
FYE 4/2011 revenue down 50% (511 mil to 223mil) PAT down 59% (71 mil to 29 mil) - value destruction.
Cumulative 2 lastest quarters, revenue - 107mil PAT 15mil.
Annualised FYE 4/2012, revenue - 214mil PAT 30 mil.
FYE2012 results will be slightly better than FYE2011.
| Changes In Shareholder |
| Date | Stock | Name | Type | Qty |
| 11 Aug 2011 | HAIO | TAN SIOW ENG | Acquired | 21,900 |
| 11 Aug 2011 | HAIO | PHAN VAN DENH | Acquired | 21,900 |
| 11 Aug 2011 | HAIO | TAN KENG KANG | Acquired | 21,900 |
| 11 Aug 2011 | HAIO | TAN KENG SONG | Acquired | 21,900 |
| 11 Aug 2011 | HAIO | TAN KAI HEE | Acquired | 21,900 |
| 4 Jul 2011 | HAIO | TAN SIOW ENG | Acquired | 33,500 |
| 4 Jul 2011 | HAIO | TAN KENG KANG | Acquired | 33,500 |
| 4 Jul 2011 | HAIO | PHAN VAN DENH | Acquired | 33,500 |
| 4 Jul 2011 | HAIO | TAN KAI HEE | Acquired | 33,500 |
| 4 Jul 2011 | HAIO | TAN KENG SONG | Acquired | 33,500 |
| 31 Jan 2011 | HAIO | AKINTAN SDN BHD | Acquired | 40,100 |
| 31 Jan 2011 | HAIO | TAN SIOW ENG | Acquired | 40,100 |
| 31 Jan 2011 | HAIO | PHAN VAN DENH | Acquired | 40,100 |
| 31 Jan 2011 | HAIO | TAN KENG KANG | Acquired | 40,100 |
| 31 Jan 2011 | HAIO | TAN KAI HEE | Acquired | 40,100 |
| 31 Jan 2011 | HAIO | TAN KENG SONG | Acquired | 40,100 |
| 26 Jan 2011 | HAIO | AKINTAN SDN BHD | Acquired | 40,400 |
| 26 Jan 2011 | HAIO | TAN KENG KANG | Acquired | 40,400 |
| 26 Jan 2011 | HAIO | TAN SIOW ENG | Acquired | 40,400 |
| 26 Jan 2011 | HAIO | PHAN VAN DENH | Acquired | 40,400 |
| 26 Jan 2011 | HAIO | TAN KAI HEE | Acquired | 40,400 |
| 26 Jan 2011 | HAIO | TAN KENG SONG | Acquired | 40,400 |
| 30 Dec 2010 | HAIO | AKINTAN SDN BHD | Acquired | 41,000 |
| 30 Dec 2010 | HAIO | PHAN VAN DENH | Acquired | 41,000 |
| 30 Dec 2010 | HAIO | TAN SIOW ENG | Acquired | 41,000 |
| 30 Dec 2010 | HAIO | TAN KENG KANG | Acquired | 41,000 |
| 30 Dec 2010 | HAIO | TAN KENG SONG | Acquired | 41,000 |
| 30 Dec 2010 | HAIO | TAN KAI HEE | Acquired | 41,000 |
| 24 Dec 2010 | HAIO | AKINTAN SDN BHD | Acquired | 50,000 |
| 24 Dec 2010 | HAIO | TAN KENG KANG | Acquired | 50,000 |
| 24 Dec 2010 | HAIO | PHAN VAN DENH | Acquired | 50,000 |
| 24 Dec 2010 | HAIO | TAN SIOW ENG | Acquired | 50,000 |
| 24 Dec 2010 | HAIO | TAN KAI HEE | Acquired | 50,000 |
| 24 Dec 2010 | HAIO | TAN KENG SONG | Acquired | 50,000 |
| 5 Oct 2010 | HAIO | Phan Van Denh | Acquired | 118,000 |
| 5 Oct 2010 | HAIO | Tan Keng Kang | Acquired | 118,000 |
| 5 Oct 2010 | HAIO | Tan Siow Eng | Acquired | 118,000 |
| 5 Oct 2010 | HAIO | Tan Keng Song | Acquired | 118,000 |
| 5 Oct 2010 | HAIO | Tan Kai Hee | Acquired | 118,000 |
| 5 Oct 2010 | HAIO | Akintan Sdn Bhd | Acquired | 118,000 |
| 25 Aug 2010 | HAIO | Quek Ah Ba | Disposed | 40,704 |
| 9 Aug 2010 | HAIO | Datin Sunita Mei-Lin Rajakumar | Disposed | 33,500 |
| 28 Jul 2010 | HAIO | Datin Sunita Mei-Lin Rajakumar | Disposed | 33,500 |
| 19 Jul 2010 | HAIO | Datin Sunita Mei-Lin Rajakumar | Transferred | 100,636 |
Insider move
From the list above, insiders including Tan Kai Hee has been net buyer for the last one year.
| Shares Buy Back |
| Date | Stock | Shares Acquired (Cancelled) |
| 6 Jan 2012 | HAIO | 2,000 |
| 5 Jan 2012 | HAIO | 3,000 |
| 4 Jan 2012 | HAIO | 2,400 |
| 3 Jan 2012 | HAIO | 3,400 |
| 30 Dec 2011 | HAIO | 2,800 |
| 29 Dec 2011 | HAIO | 2,700 |
| 28 Dec 2011 | HAIO | 3,600 |
| 22 Dec 2011 | HAIO | 1,000 |
| 21 Dec 2011 | HAIO | 2,600 |
| 20 Dec 2011 | HAIO | 4,800 |
| 19 Dec 2011 | HAIO | 7,300 |
| 16 Dec 2011 | HAIO | 2,400 |
| 15 Dec 2011 | HAIO | 3,600 |
| 14 Dec 2011 | HAIO | 4,400 |
| 13 Dec 2011 | HAIO | 2,400 |
| 9 Dec 2011 | HAIO | 3,400 |
| 8 Dec 2011 | HAIO | 2,100 |
| 7 Dec 2011 | HAIO | 4,600 |
| 6 Dec 2011 | HAIO | 4,000 |
| 5 Dec 2011 | HAIO | 4,000 |
| 2 Dec 2011 | HAIO | 10,200 |
| 2 Dec 2011 | HAIO | 7,000 |
| 1 Dec 2011 | HAIO | 7,000 |
| 30 Nov 2011 | HAIO | 1,300 |
| 29 Nov 2011 | HAIO | 4,000 |
| 25 Nov 2011 | HAIO | 8,500 |
| 24 Nov 2011 | HAIO | 2,500 |
| 23 Nov 2011 | HAIO | 4,900 |
| 22 Nov 2011 | HAIO | 11,100 |
| 21 Nov 2011 | HAIO | 5,200 |
| 18 Nov 2011 | HAIO | 2,600 |
| 17 Nov 2011 | HAIO | 2,200 |
| 25 Oct 2011 | HAIO | 2,500 |
| 24 Oct 2011 | HAIO | 2,200 |
| 7 Oct 2011 | HAIO | 1,400 |
| 6 Oct 2011 | HAIO | 2,600 |
| 5 Oct 2011 | HAIO | 2,100 |
| 4 Oct 2011 | HAIO | 3,400 |
| 3 Oct 2011 | HAIO | 10,000 |
| 30 Sep 2011 | HAIO | 3,000 |
| 29 Sep 2011 | HAIO | 5,000 |
| 22 Sep 2011 | HAIO | 12,400 |
| 21 Sep 2011 | HAIO | 4,800 |
| 20 Sep 2011 | HAIO | 8,600 |
| 19 Sep 2011 | HAIO | 3,200 |
| 15 Sep 2011 | HAIO | 3,400 |
| 14 Sep 2011 | HAIO | 21,900 |
| 13 Sep 2011 | HAIO | 5,000 |
| 12 Sep 2011 | HAIO | 8,700 |
| 9 Sep 2011 | HAIO | 2,700 |
The Company has implemented share buy back scheme although effect may be negligible.
Fundamental Observation:
1. Profitability is improving
2. Consumerism sector remain a core pillar in country wealth creation – a main contributor to GDP in recent quarters.
3. Insider moving back to the stock
4. Share buy back.
TA Observation:
1. The stock bottom in Oct 2011
2. Making a 20% gain by end of Oct 2011
3. Flattening for next 2 – 3 months til Dec 2011.
4. Price and volume move again in Jan 2012 – the engine is ignited and the long night happening party began.
5. NOW: The stock is overbought now and facing a resistance at 2.40 level – profit taking began
6. A Dark Cloud Cover emerged on 19/1/2012 – signify the beginning of distribution.
Action:
Wait for retracement to MA50/100 to accumulate.