Thursday, April 26, 2012

FBMKLCI ERROR!


Is Bursa system down early in the morning today!

FBMKLCI : - 5.93
UP 12 counters
Down 5 counters with total - 1.95

How can KLCI go down more than total down whilst there are 12 up counters? Puzzling !!!!!

Wednesday, April 25, 2012

Market Pulse


USDMYR has been moving side way for the last one month. Based on chart below, KLCI is sliding lower from all time high of 1600 point. It is either local funds are selling of foreign funds are selling but money remain on shore.

I believe a lot of optimism is required to break through 1600 level. With general election around the corner, no one probably willing to open a position at such price level.

Monday, April 23, 2012

The 7 Puzzles Of The Global Economy


Taken this from Dali's Blog. Very interesting.


JPMorgan's Jan Loeys and others are out with a cool note looking at "seven puzzles" regarding the global economy.

In each case, they lay out a question, and then give their best stab at an answer. The not so humble me will also offer my own take (in colour).
Here's our condenses/summarized version of each one:
  • Why haven't Greece or Germany left the Euro yet? Basically, the monetary union was always the first step to full-on political union. Leaving the Euro would be a return to the dark days of a divided Europe. (Greece cannot leave because the alternative is disastrous for Greece, it would have to go back to their drachma, which will see massive higher inflation day to day for a long time; making it near impossible to raise any drachma bonds, thus creating an economy that really runs on black market USD and Euros anyway. Germany can exit but having an undivided Europe is a major platform which they have taken leadership from the start. Its almost come to the point of no return for Germany and France).

  • Why has the Euro currency not collapsed? The region has no external trade deficit, and funding concerns have led to Euro trade repatriations. (It is still the most liquid currency after USD, though not reserve status, its the closest we have to USD).

  • Why are high-grade corporate credit spreads still so high? They're being distorted a bit by financials, which are now permanently seen as riskier in the post-Lehman world. 

  • Why do investors love yieldless Treasuries? Basically, there's still a big appetite for risk-less appetites. Also: Financial repression. (This ties in with th previous question, while central banks have been pumping liquidity, much of it has gone to so called riskless Treasuries and other similar bonds, at the expense of corporate bonds, and only a fraction are finding its way back to equities. This is why there is currently a huge bubble in these type of bonds, as not enough consideration or risk have been allocated to the debasement of all major currencies).

  • Why is there no deflation, given large global output gaps? The output gaps may be overstated. Central banks are doing a good job keeping inflation expectations high. (This is a surprising thing. The gold bugs have been harping on hyperinflation following the deluge of easing, but that did not happen. Now there are people harping on deflation because the real economy may be a lot weaker than anticipated even with the multiple injections of liquidity. Finance experts and economists are a dime a dozen, they can swing from one end to another all within the same analysis - and sound convincing at the same time. Be careful).

  • Why have commodity prices soared despite the mediocre post-crisis recovery? Because commodity project financing evaporated during the crisis, output has been constrained. (This points to the pockets of sustained economic activity that is not in the US or Europe. Not enough attention being paid to the markets in Asia and Latin America, misinformation).

  • Why do Japanese corporates keep buying Japanese Government Bonds, despite sky high government debt? Domestic financial repression, as well as high real yields, given ongoing deflation. (Technically, Japan is the most indebted country and by right the yen should halve their value. But Japan has one thing that most other developed countries don't - a homogeneous society. Call it what you like, to them savings in postal offices and local banks are paramount to safety, a false impression. Do they know that they are funding the enormous debt incurred by the country - maybe, maybe its part of being patriotic. Most other nations would have seen their citizens withdrawing these funds and shoving them in other currencies to mitigate losses. The same goes for most Japanese corporates, they are still repatriating foreign exchange back to yen, thus increasing demand for the yen. Give that to US corporates, they will find ways to mitigate their yen exposure). 


Read more: http://www.businessinsider.com/jpmorgan-solves-7-big-puzzles-about-the-global-economy-2012-4#ixzz1sjaQULhk


Wednesday, April 11, 2012

UOADev - Dividend Reinvestmnet Plan

UOA Dev announced a dividend reinvestment scheme. This scheme allows shareholders to reinvest div income at lower price at max 10% discount of 5-day weighted average price prior to price fixing.

Background info:
- listed in June 2011 at RM2.90.
- Hit low RM1.20 losing 50% within 3 months in Sep 2011
- it explained that investment community is rejecting this "good stock"
- many reasons quoted to explain the poor performance of this stock include:
1. Single location play - UOA Bangsar
2. Property is cyclical play
3. Share overhang

Comments on Scheme:
- This type of scheme is only beneficial for long term play. Eg - Maybank case - "monopolistic" and ever green kind of business
- UOADev stuck in cyclical property business also strained by highly land cost (as land price and prime area keep going up), market sentiment and highly competitive business environment.
- with the recent upsurge in property market, the emergence of new developers mushrooming taking advantage of high property price.
- UOADev is having good cash flow now due to robust sales achieved - hence good dividend payout
- Knowing the characteristics of UOADev, the purpose of investment is taking into consideration of 1. depressed valuation 2. good cash flow during property boom 3. expectation of distribution of excess cash flows as dividend.
- Hence, in long term view, you should take the cash dividend instead of the scheme.

BUT
- Technical wise, the chart culminating as perfect symmetrical triangle for the last 6 months after a drop of 50%
- this signify a significant support/accumulation level at the moment that may be completed soon.
- knowing the 10% dividend per share translates into 6% to 7%  yield, paying out in June/July 2012, it should be some interests on this stock for the next 2 - 3 months.

Tuesday, April 10, 2012

DJI

 DJI is pointing south for consecutive 5 days.


VIX is pointing up at 20 now.


Monday, April 9, 2012

QE Impact on doubling property price in Malaysia

A very good article from "rich dad poor dad". It probably give u a little clue as to why property prices at certain locations in Klang Valley doubled within 2 to 3 years upon completion.


When The Fed Prints Money, What Impact Does It Have On You?

The Federal Reserve, the United States central bank, has “printed” more than $2 trillion since the global economic crisis began in 2008. This has more than tripled the size of its balance sheet. Before this spree of paper money creation began, the Fed held $950 billion in assets; now it holds nearly $3 trillion. Why did they do this and what impact has it had on you, the general public?

They did it to prevent the global credit bubble that had been forming for decades from completely imploding. It is probable that the global economy would have collapsed into a New Great Depression had the Fed not printed so much money. Of course, we cannot know what would have happened for sure. Nevertheless, it is clear that the Fed’s actions supported the economy in three crucial ways.
First, it allowed the US government to finance $4 trillion of budget deficits (over three years) at extremely low interest rates. How did that work? The Fed created $2 trillion from thin air and used it to buy government bonds and other debt instruments (mostly mortgage-backed securities) from the market. The people from whom they bought the bonds then had $2 trillion in cash. Some of that cash was invested in the new Treasury bonds the government had to sell each month to finance its deficit. So, by directly buying government bonds and by injecting cash into the market that other people used to buy government bonds, the Fed made it much easier for the government to spend $4 trillion more than it took in as tax revenues. That government spending kept the economy from collapsing. (To understand how, review Economic Forecasting, 101, posted February 15, 2012.)

Next, that “injection” of $2 trillion of new money meant that there was a lot of money sloshing around in the financial markets. Some of that new money was invested in bonds, which pushed up the price of those bonds. When bond prices rise, their yields (or the interest rate the bonds pay) fall. Therefore, the creation of paper money by the Fed pushed interest rates lower. Consequently, the cost of mortgages, car loans and other consumer credit all fell. Lower mortgage rates kept home prices from dropping even further than they have; and lower interest rates on consumer credit supported consumer spending (and therefore the GDP).

Finally, money printing pushed up the stock market. The Fed does not like to say that it is “printing” or creating new money. Instead, Fed officials use the term Quantitative Easing to describe their money creating activities. There have been two rounds of Quantitative Easing, QE 1 and QE 2. During both rounds, stock prices rose sharply. Higher stock prices make people richer (so long as they remain high, at least); and when people are richer they spend more money. That spending supports the economy and it creates jobs and it generates tax revenues, which reduce the government’s budget deficit.

So, what’s not to like? Paper money creation allows the government to spend more, it keeps interest rates low and it makes stock prices high. It sounds too good to be true. And, it is. There are negative consequences (both actual and potential consequences) that I have not yet mentioned. The worst actual consequence so far has been a sharp increase in food and gasoline prices.

It has been known for centuries that printing money creates inflation. There are different kinds of inflation, however. These can be grouped into three categories: CPI ex-food & energy, asset price inflation and commodity price inflation. Let’s consider each.

The most closely watched kind of inflation is Consumer Price Inflation (excluding food and energy) or core CPI as it is often called. This measures the price increases for the things consumers buy such as clothing, electrical goods and cars; but it excludes the price of food and energy because these are considered to be too volatile. During the 1970s, core CPI spiked as high as 13.6%. Since then it has fallen steadily and it now stands at only 2.2% compared with one year ago. The reason it has fallen is Globalization, which has resulted in a collapse in the cost of hiring workers in the manufacturing industry. Before, it was necessary to pay a blue collar worker in Michigan $200 per day to work in a car factory. Now cars can be built in India using $3 a day labor. This collapse in wage rates has had the benefit of holding down inflation in the US; however, it has produced undesirable consequences of its own (to be discussed some other time). So long as Globalization persists, there will continue to be downward pressure on wages and therefore little core inflation. Protectionism would cause US wages to rise, but it would cause a sharp spike in inflation.

The second category of inflation is asset price inflation, or, in other words, inflation in the price of stocks and bonds. As discussed above, Quantitative Easing did cause a significant increase in stock prices and bond prices. In fact, one of the Fed’s main goals in printing money was to create asset price inflation. In this they have been very successful.

The problem comes with the third category of inflation, commodity price inflation. Gasoline prices are not $4 per gallon due to supply and demand factors, but rather because too much money creation has pushed up oil prices. Even worse, from a global perspective, is the surge in food prices that has resulted from the Fed’s actions. During QE 2, global food prices soared 60%. This has done much more damage than simply driving up the price of milk and bread at the local grocery store. It has created a humanitarian disaster for the 2 billion people (29% of mankind) who live on less than $2 per day. Higher food prices played a leading role in igniting the Arab Spring, the political uprisings that overthrew three North African governments and threaten to overthrow several more governments across the Middle East. The ultimate outcome of those revolutions is still undecided. It has been said that revolutions devour their offspring. They have also been known to frequently devour their neighbors. Saudi Arabia is in that neighborhood. We can hope for a democratic outcome that works to everyone’s advantage. That outcome is by no means assured, however. A third round of Quantitative Easing would cause another spike in food prices and that could cause more hunger-inspired revolutions to erupt all around the developing world, with more destabilizing geopolitical consequences.

Those are the actual consequences of printing money. Hyperinflation is the worst potential consequence. So far, inflation remains low. However, paper money creation has a long and ignoble history. It has almost always ended in tragedy. The great American economist, Irving Fisher (1867 - 1947) put it this way, “Irredeemable paper money has almost invariably proved a curse to the country employing it.” Time will tell if it eventually proves to be a curse for the United States (and Europe and England and Japan and …).

Gold

40-year gold chart.
Back in early 70s, gold price was below USD100 and now it hits high of USD1,800. For those of us born after World War I and II could never appreciate the importance of gold as a vehicle to store value! If you talk to any investor or business man, they will tell you that it is dumb to invest in gold. As Warren Buffet, the legendary investor puts it, "you dig a hole to produce gold and dig another to store it". Worst still gold does not produce income. so why invest in gold? Well having said all this while, probably Warren Buffet is the one that keeping a lot of gold.  

Gold has gone through the test of time even during ancient time it is still the best vehicle to store wealth. Hence wealthy people will always think of gold during slow economy growth and uncertain time. During economy boom time, wealth is invested for various forms of economic activities such as boosting production capacity, services, building infrastructure, spending on luxury goods and even lend to somebody. To sum-up, wealth will be be placed with productive activities that produces economic returns. Hence who cares about buying gold during this period. Observe the period from early 1980s all the way to early 2000s. Gold price has been depressed for a period of 20 years. Gold price always has an inverse relationship with economic growth.

This chart is relevant to Malaysian readers. For those ladies who are keeping gold jewellery, are you aware that you wealth has at least quadruple by now! Should you sell them now and buy back latter! Haha......

Monday, April 2, 2012

DRB


chart that i like.

Market Pulse


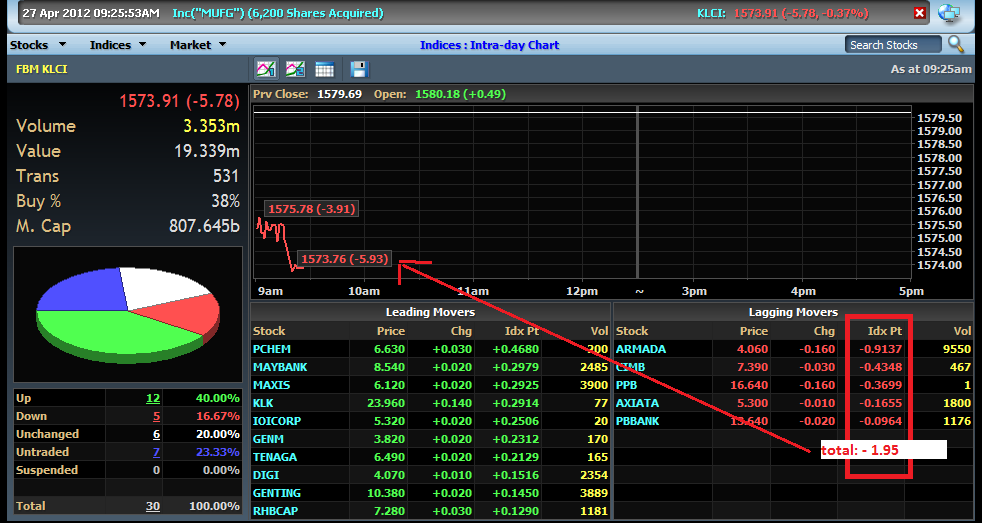
KLCI at all time high. Najib machinery has started to deploy with the announcement on CIMB aquiring RBS's Asia Pacific asset.


Ringgit at 3.08 on 20 March


Ringgit at 3.04 on 20 March

A short term bull is in the making.